
Your recovery score reflects autonomic nervous system balance—HRV, resting heart rate, respiratory rate, and skin temperature—not muscle damage or injury risk. Trust it most when low scores align with raised RHR and depressed HRV, since these drive roughly 70% of the number. Give your device 14-30 days to build a personal baseline, since accuracy sits around 70-75%. You’ll want to weigh it against how you actually feel—the details below explain exactly how.
TLDR Key Takeaways
- Recovery scores reflect autonomic nervous system balance, not muscle damage, injury risk, or true tissue healing.
- Trust baselines only after 14–30 days of consistent wear; full personalization can take 60+ days.
- Independent studies show roughly 70–75% accuracy, with error rates up to 40% in some cases.
- Watch weekly trends and multi-day patterns rather than reacting to a single day’s score.
- Treat scores as a starting estimate, cross-checked with subjective feeling and personal history, not absolute verdicts.
What Your Recovery Score Actually Measures
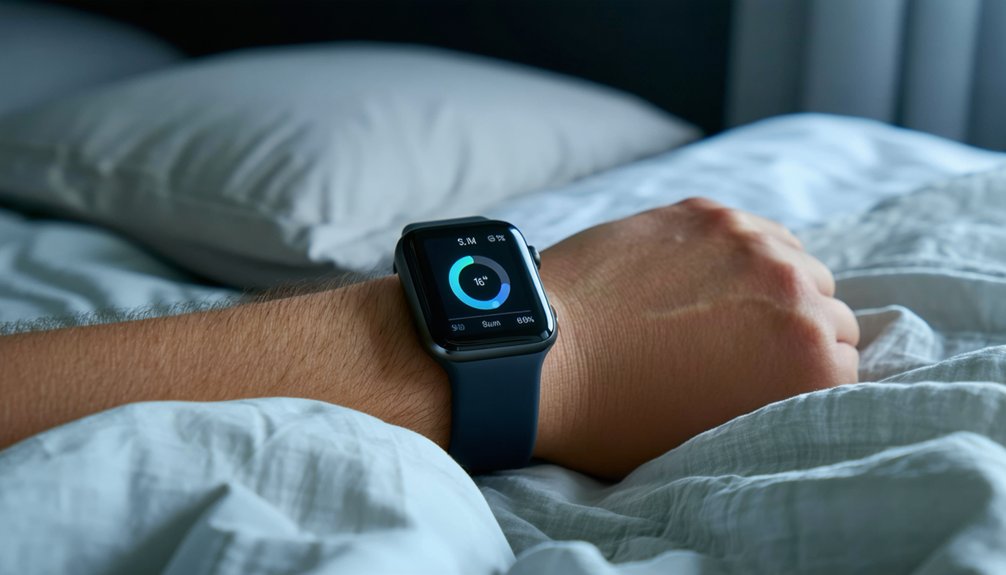
When your watch flashes a recovery score, it’s really summarizing how well your autonomic nervous system bounced back from stress. That score isn’t a mood ring—it’s a composite built from real data. In fact, some algorithms weigh over 20 body signals to generate this single number.
Heart rate variability (HRV) drives the calculation: higher HRV signals a relaxed, recovered system, while lower HRV means you’re still carrying stress. Your resting heart rate, respiratory rate, blood oxygen saturation, and body temperature all feed into this autonomic balance calculation, painting a portrait of whether your sympathetic or parasympathetic system is dominant right now. Much like a webpage that fails to load correctly, showing a 404-error instead of the intended content, a recovery score can misfire when its underlying data modules don’t sync properly.
Here’s the catch: sensor limitations exist. Your tracker measures physiological signals, not tissue healing or muscle damage. It can’t detect injury risk. Factors like skin tone, tattoos, or cold temperature can also throw off sensor readings, so accuracy isn’t guaranteed. It’s reading stress and capacity—nothing more, nothing less. Know what it actually tracks, and you’ll use it smarter.
How Your Wearable Comes Up With That Number
Strip away the marketing gloss, and you’ll find a fairly consistent formula humming beneath every recovery score. HRV drives the calculation, compared against your personal 14-day baseline. Sleep quality adds weight—Whoop leans on deep sleep at 35%, Garmin favors duration at 45%. Strain factors in too, with both platforms assigning roughly 25% to training load via TRIMP calculations.
This is sensor fusion in action: your wearable blends HRV, respiratory rate, SpO2, and skin temperature—sometimes up to 20 signals—into one number. That’s the trade-off you’re making. You gain a simple score, but algorithm transparency stays limited. Companies guard their exact formulas, so you’re trusting proprietary math with your daily decisions.
Give it 14-30 days minimum before you trust what it’s telling you. Even then, the score is only a starting point—a low reading often reflects real detractors like poor sleep, illness, high prior-day strain, or stress rather than a flaw in the algorithm itself. In fact, a constantly perfect reading isn’t necessarily good news, since an unbroken run of 100% scores can signal your training stimulus simply isn’t challenging enough. Independent validation studies show these algorithms predict physical readiness with roughly 70–75% accuracy, so treat the number as a useful estimate rather than gospel.
Why Recovery Scores Sometimes Miss the Mark
Trust that formula too much, and you’ll hit its limits fast. Your wearable can’t see muscle damage, nutrition quality, or localized stress—these algorithmic blindspots mean up to 40% error rates in what shows up on your screen. HRV and sleep staging, the two pillars behind most scores, are notoriously unreliable estimates, not verified facts about your body.
The algorithm also can’t account for personalized exceptions: your hormonal cycle, that glass of wine last night, travel fatigue, or the stress from work you’re carrying. It bundles assumptions—like less sleep always meaning lower recovery—that ignore your unique biology. Major manufacturers like Fitbit, Oura, WHOOP, and Garmin rely on proprietary algorithms that remain largely undisclosed, making it difficult to know what’s actually driving your score. When something goes wrong, these platforms often default to a generic 404-Error page rather than transparent diagnostic feedback about the failure. Even conditions like overtraining or sleep apnea can’t be diagnosed from a single readiness score, no matter how confident the number looks.
You know your body better than a closed proprietary model ever will. The number’s a data point, not a verdict.
Why Your Body Beats the Algorithm
Because your wearable can’t scan your muscle mass, hydration, or hormone levels in real time, it leans on static inputs and generalized assumptions instead of your actual physiology.
Your body isn’t a template—it’s a living system that shifts by the hour. Sensor bias creeps in through skin tone, BMI, and muscle composition, all skewing how light reflects back to the algorithm. Add vascular variability from age, stress, or cold exposure, and you’ve got a device guessing at signals your body already knows intimately. In fact, a Stanford study found that none of the seven wearable devices tested could accurately estimate energy expenditure, with the best performer still off by 27 percent.
Your lactate threshold, your vascular response, your recovery capacity—these are yours alone, not averages pulled from a dataset. Standardized zones can’t capture that subtlety. Most wrist-based trackers rely on photoplethysmography, flashing LED light onto your skin hundreds of times per second just to estimate a single heartbeat. Even advanced detection tools require at least 30 minutes of steady data before flagging anything meaningful, showing how much these devices rely on prolonged, ideal conditions rather than instant physiological truth. Trust the data as a starting point, but let your own signals—energy, soreness, clarity—call the final shot.
Can You Trust a Low Recovery Score?
So your device misreads your physiology sometimes—does that mean you should ignore a low score altogether? Not quite. The answer lies in cross-referencing, not blind faith.
Trust a low score when it aligns with elevated resting heart rate and depressed HRV. That convergence signals real strain, not sensor calibration drift or a bad night of contact. Remember that these two metrics alone account for 70% of your recovery score, so their alignment carries far more weight than duration ever could. But if the score contradicts your user perception—you feel strong, rested, clear-healed—the full context overrides the number.
When ingredients disagree with the score, slow down rather than stop entirely. Compare today’s reading against your own history, not someone else’s baseline. One low score means little. A three-day trend paired with matching biomarkers means something. Keep in mind that some users have found their recovery score drop even during lighter training, since higher HRV peaks during heavy training can raise your personal average and make normal lower readings look artificially low. WHOOP can even detect illness or stress before you consciously notice symptoms, since it relies on HRV and RHR data rather than subjective feeling. That’s your signal to act—everything else is noise demanding patience, not panic.
Why a High Score Doesn’t Guarantee a Great Workout
Even when your score hits 95, that number only measures nervous system readiness—it says nothing about whether tissue is healed, muscles have recovered from damage, or you’ll actually feel sharp under the bar. Capability isn’t the same as necessity. A high score gives you permission to train, not an order to max out every lift.
Treat it as a green light, not a command. Progress your load slightly instead of chasing a dramatic jump in intensity. Schedule your hardest session of the week for these days, so you’re not stacking maximal efforts back-to-back.
Check your mental readiness before deciding session pacing—if you feel flat despite a high score, trust that feeling. Prioritize clean technique over piling on volume. Real freedom comes from reading your body, not just your screen.
Reading the Green, Yellow, and Red Recovery Zones
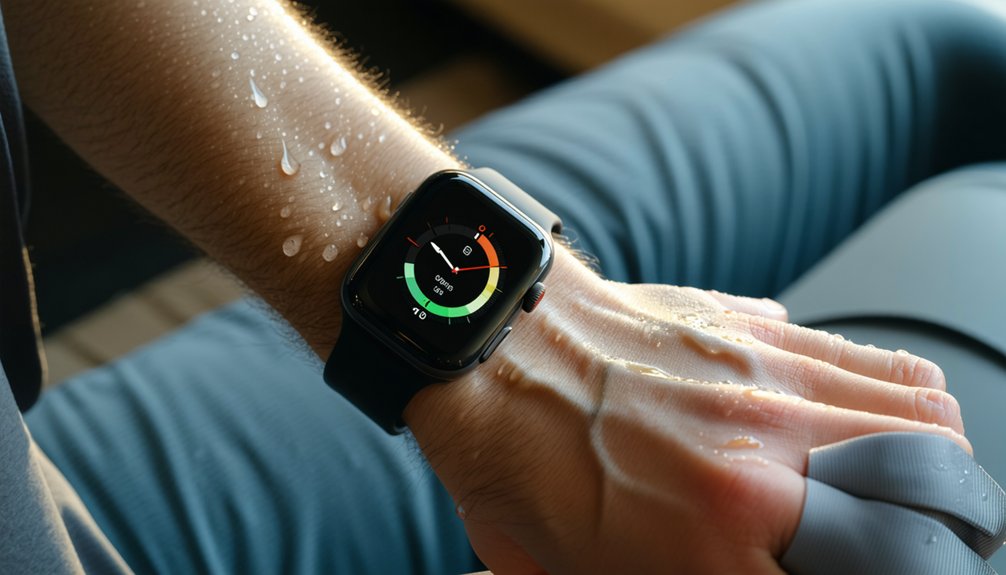
Once you understand that your recovery score is really a color-coded readout of autonomic nervous system balance, the three zones become a lot easier to act on.
Green (67–100%) means parasympathetic dominance—your body’s ready for strain of 14-18+ points, PRs, and competition. Yellow (34–66%) reflects a mixed autonomic state: aim for 10-14 strain points with moderate or skill-based work. Red (0-33%) signals sympathetic dominance, heightened stress, and a need to drop strain under 10 points, swapping intensity for Zone 2 cardio or mobility.
Each zone reflects your body’s autonomic variability, not a fixed rulebook. Use these signals to guide training periodization—stacking hard efforts when you’re primed, backing off when you’re not. That’s how you train smarter, not harder, and stay free from guesswork.
Spotting Fatigue Trends in Your Recovery Score
Knowing your zone on any given day only tells half the story—the real signal comes from watching how your scores move over time.
Don’t react to a single dip; instead, apply trend smoothing across a week or two of readings to see what’s actually happening beneath the noise. A stable score with a slow, downward slope matters more than one red day among six greens.
Watch for baseline shifts greater than 15% from your established norm—that’s your real threshold, not some vendor-defined “optimal” number.
Four consecutive declining scores deserve your attention far more than a single off day.
Your body’s autonomic system tells the truth over weeks, not hours. Trust the pattern, not the panic.
Building a Recovery Score Baseline That Actually Works
Because HRV swings 2-3x between individuals, your baseline has to be personal, not pulled from some population average. That’s why the window matters: most devices need 14-30 days of consistent wear before the algorithm learns your patterns. WHOOP runs a 30-day weighted average, while Garmin’s Body Battery pulls from a shorter window. A 2025 Sports Medicine study found 14-day baselines hit 73% accuracy—proof that shorter isn’t automatically worse.
What actually breaks baseline variability is inconsistency. Switching devices resets device calibration and forces the algorithm to relearn you from scratch. Pick one system, wear it the same way daily, and stick with it. Accuracy keeps climbing past day 60, once your data captures real training loads and real-life stress. That consistency is what sets you free from guesswork.
Give Your Tracker 60 Days Before Judging It
Sixty days sounds like a long time to wait, but that’s exactly the point. Your initial calibration only takes 14 to 30 days—that’s just your device learning the basics. Real accuracy shows up after you push through the full personalization timeline. Your algorithm needs to see you across hard training blocks, stressful weeks, and easy stretches before it truly understands your patterns.
Don’t judge your tracker on day 10. Don’t switch systems on day 20 because a score felt off. Give it the full 60 days on one platform before you decide whether it’s earning your trust.
Even then, stay realistic: validation studies show 70-75% accuracy in predicting readiness. That’s useful, not infallible. Calibration builds the foundation—your ongoing awareness completes the image.
Sleep and Nutrition: Your Real Recovery Foundation
While your recovery score gives you a number, sleep and nutrition build the foundation that number’s actually measuring. Your tracker can’t force you to sleep 7–9 hours—only you can. Solid sleep hygiene matters: consistent sleep-wake times, dimmed screens before bed, and skipping caffeine near bedtime all protect the melatonin production your body needs to shut down properly.
Nutrition works alongside sleep, not separately from it. Nutrient timing—especially that 30-minute post-workout window—drives glycogen replenishment and muscle repair. Pair carbs and protein in the right ratios, and you’re feeding tomorrow’s recovery score today.
Fiber-rich foods, tryptophan sources, and magnesium-packed greens all reinforce sleep quality. Hydration and anti-inflammatory foods round out the scene. Your habits, not your wearable, are the real recovery engine.
Recovery Score Myths Worth Ignoring
Since your recovery score looks like hard science, it’s easy to treat it as gospel—but that trust often isn’t earned. Studies show recovery scores frequently show zero correlation with actual physiological recovery, and error rates hit 40% on popular devices. Your wrist can’t capture the complex heart data needed for real calculations—it’s guesswork dressed up as precision.
Manufacturers won’t share their formulas because there’s often no rigorous science behind them—just marketing myths designed to make a gadget feel smart. Worse, these scores can’t detect muscle damage or injury risk happening beneath your skin.
Trusting a high number when you feel wrecked is a placebo effect, not readiness. Free yourself from the illusion: your body’s signals outrank an algorithm’s guess every time.
Frequently Asked Questions
Can I Compare My Recovery Score Directly With Someone Else’s Score?
No—you can’t compare your score directly with someone else’s. Population variability and device calibration mean your 70% isn’t their 70%. Trust your own trend, ditch the comparison game, and own your personal baseline instead.
Should I Switch Wearable Brands if I Don’t Like My Current Scores?
Don’t rush to change brands—reset settings and track trends first. Only switch if scores conflict with real performance over 30% of the time, or borrow a friend’s Oura Ring for a week-long test.
Does Alcohol Consumption Affect Next-Day Recovery Score Readings?
Yes—alcohol tanks your recovery score. Your alcohol metabolism spikes resting heart rate and crushes HRV, while sleep design effects disrupt REM cycles. You’ll see the damage within hours, so drink smart and reclaim your mornings.
Can Recovery Scores Predict My Risk of Getting Injured?
No—you can’t rely on recovery scores alone for injury prediction. Injury’s multifactorial. Instead, track personalized thresholds: watch for 15%+ deviations from your baseline, pair scores with movement quality checks, and trust your own patterns over generic red flags.
Will Traveling Across Time Zones Distort My Recovery Score Baseline?
Yes—crossing three or more time zones triggers jet lag, throwing circadian misalignment into your data. Your baseline skews for 3-5 days post-travel. Don’t panic: recalibrate manually, trust trends over single-day scores, and reclaim your data’s accuracy quickly.
Conclusion
Your recovery score is a data point, not a verdict. Trust the trend, not the daily number. Give your tracker 60 days to learn your baseline before you doubt it. Then pair that data with what you actually feel—energy, soreness, mood. Sleep and nutrition still drive recovery more than any algorithm. Use your score to inform decisions, not dictate them. Your body’s the final authority; the wearable’s just a helpful assistant.
References
- https://www.twopct.com/p/the-weird-science-of-recovery
- https://www.health.com/what-your-recovery-score-measures-and-how-much-it-actually-matters-for-your-health-11964431
- https://www.bevel.health/blog/what-is-recovery-score
- https://www.youtube.com/watch?v=t_5XPyDR60E
- https://betterme.world/articles/recovery-score/
- https://www.youtube.com/watch?v=aWj4-HTM8Mc
- https://blog.aihavit.com/en/workout-recovery-score-calculation-method-2026
- https://lifestack.ai/blog/recovery-score
- https://www.alibaba.com/product-insights/how-to-audit-whether-your-fitness-tracker-s-recovery-score-uses-proprietary-ai-or-transparent-biomarkers.html
- https://homefitnessbrief.com/recovery/whoop-recovery-score-home-athletes-guide

